
Azimuth is a web application that uses an annotated reference dataset to automate the processing, analysis, and interpretation of a new single-cell RNA-seq or ATAC-seq experiment. Azimuth leverages a 'reference-based mapping' pipeline that inputs a counts matrix and performs normalization, visualization, cell annotation, and differential expression (biomarker discovery). All results can be explored within the app, and easily downloaded for additional downstream analysis.
The development of Azimuth is led by the New York Genome Center Mapping Component as part of the NIH Human Biomolecular Atlas Project (HuBMAP). Fourteen molecular reference maps are currently available, with more coming soon.
References for scRNA-seq Queries
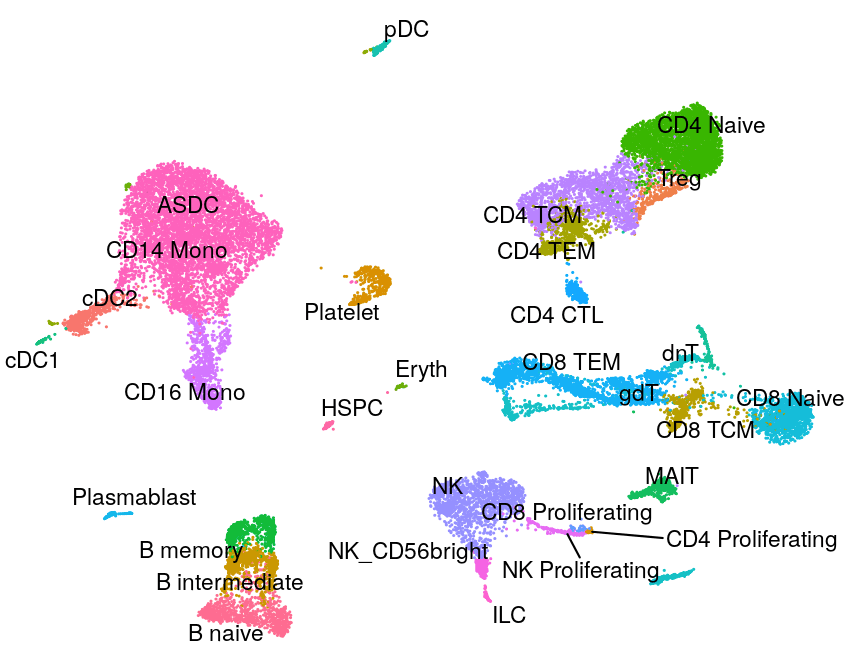
Human - PBMC
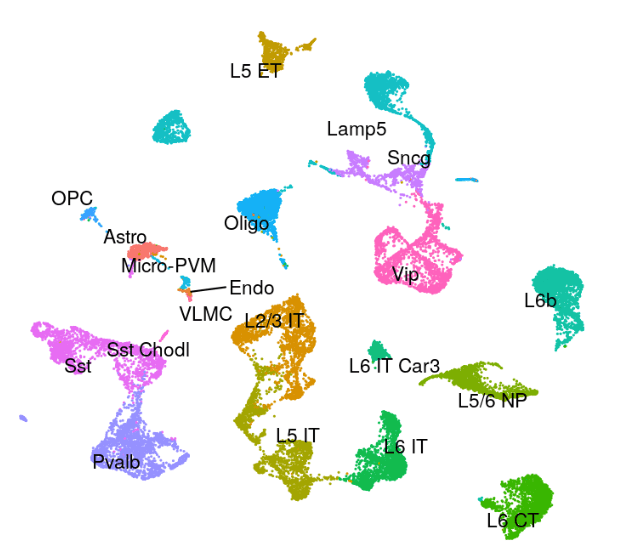
Human - Motor Cortex
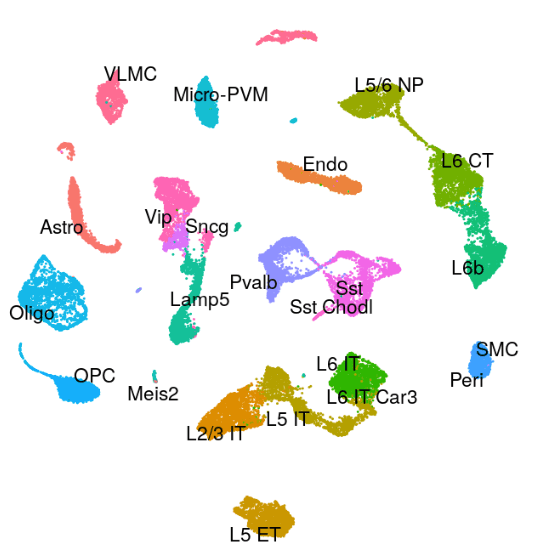
Mouse - Motor Cortex
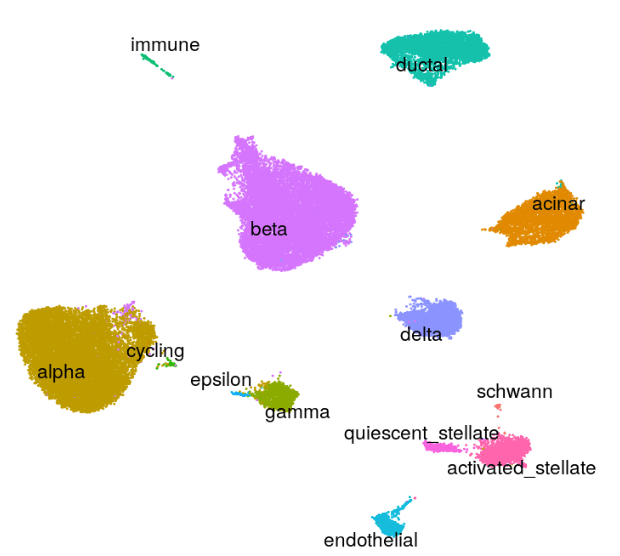
Human - Pancreas
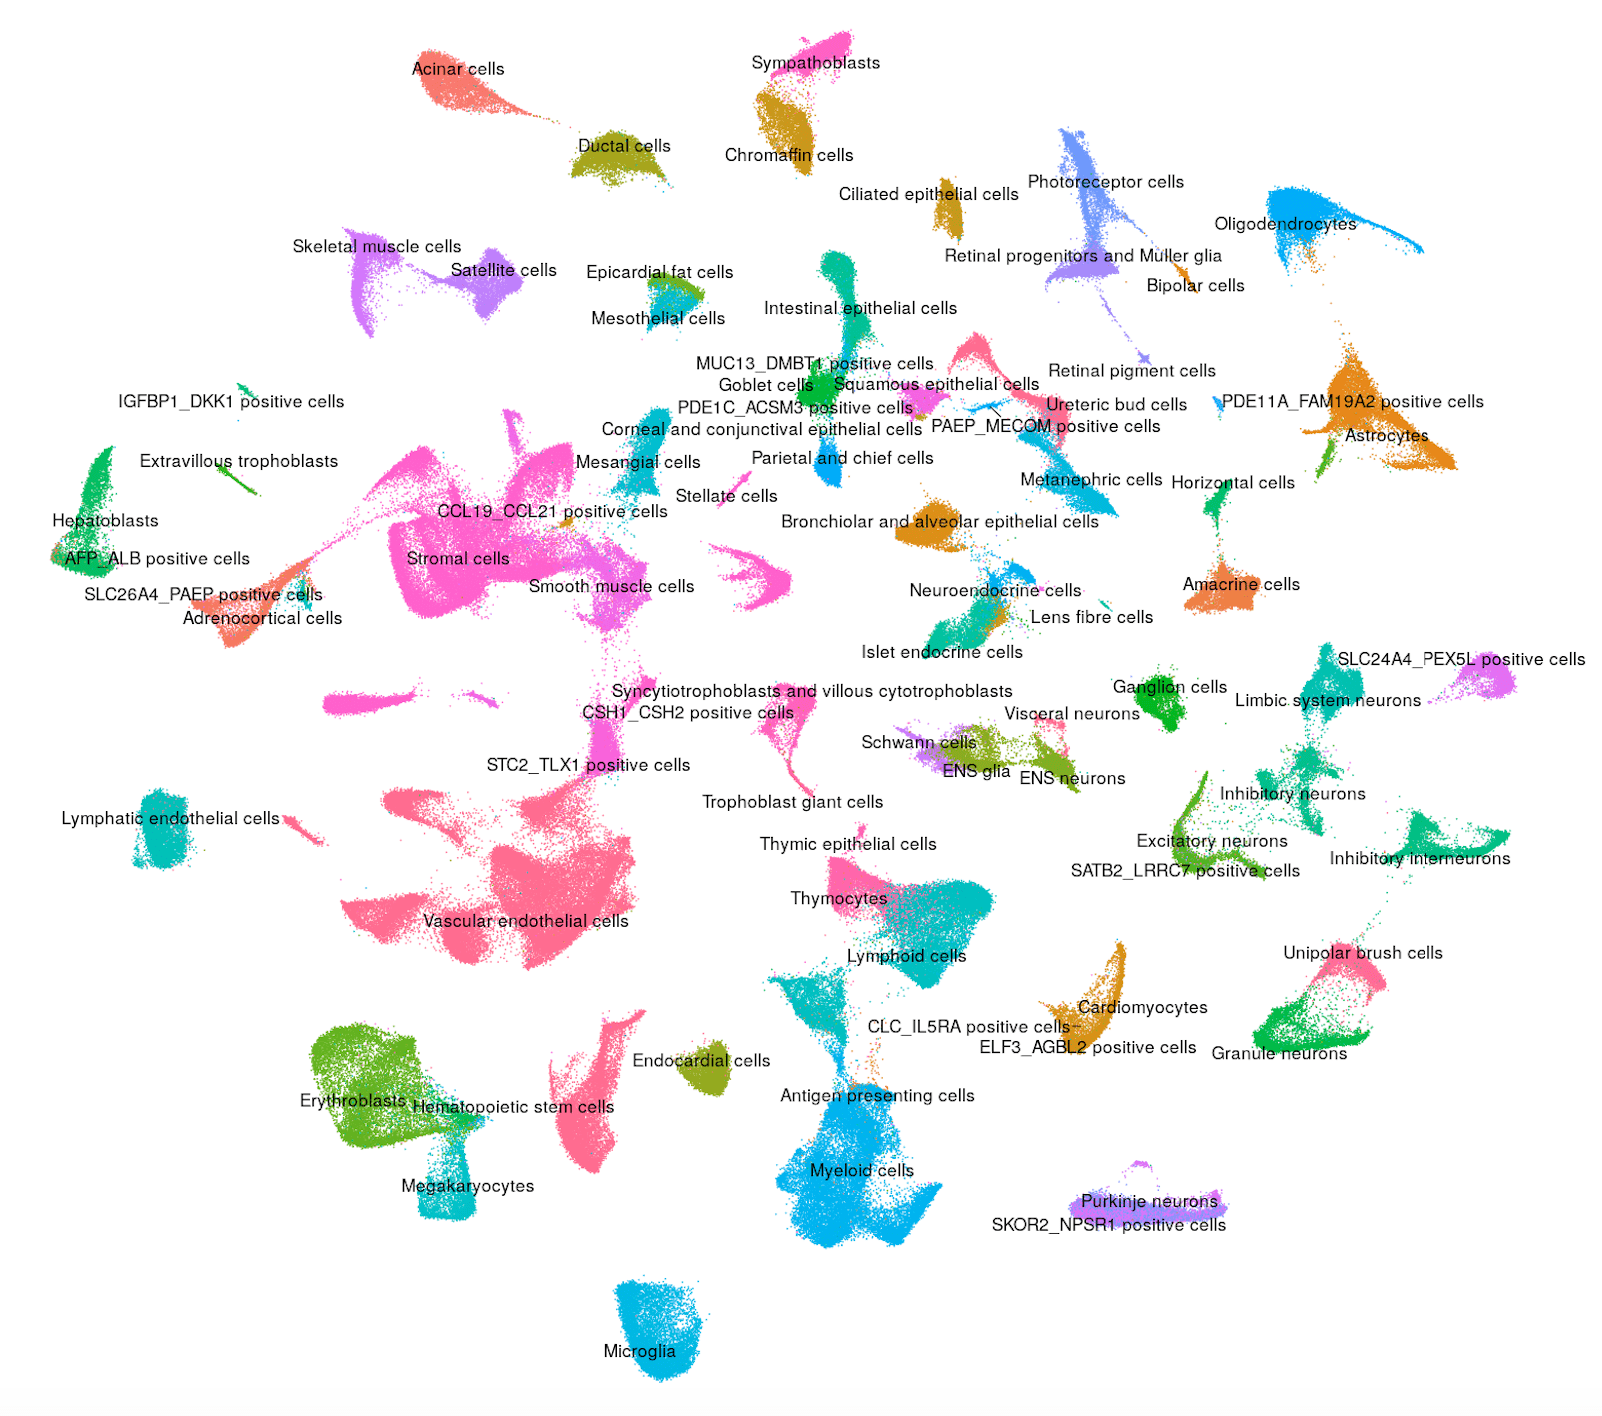
Human - Fetal Development
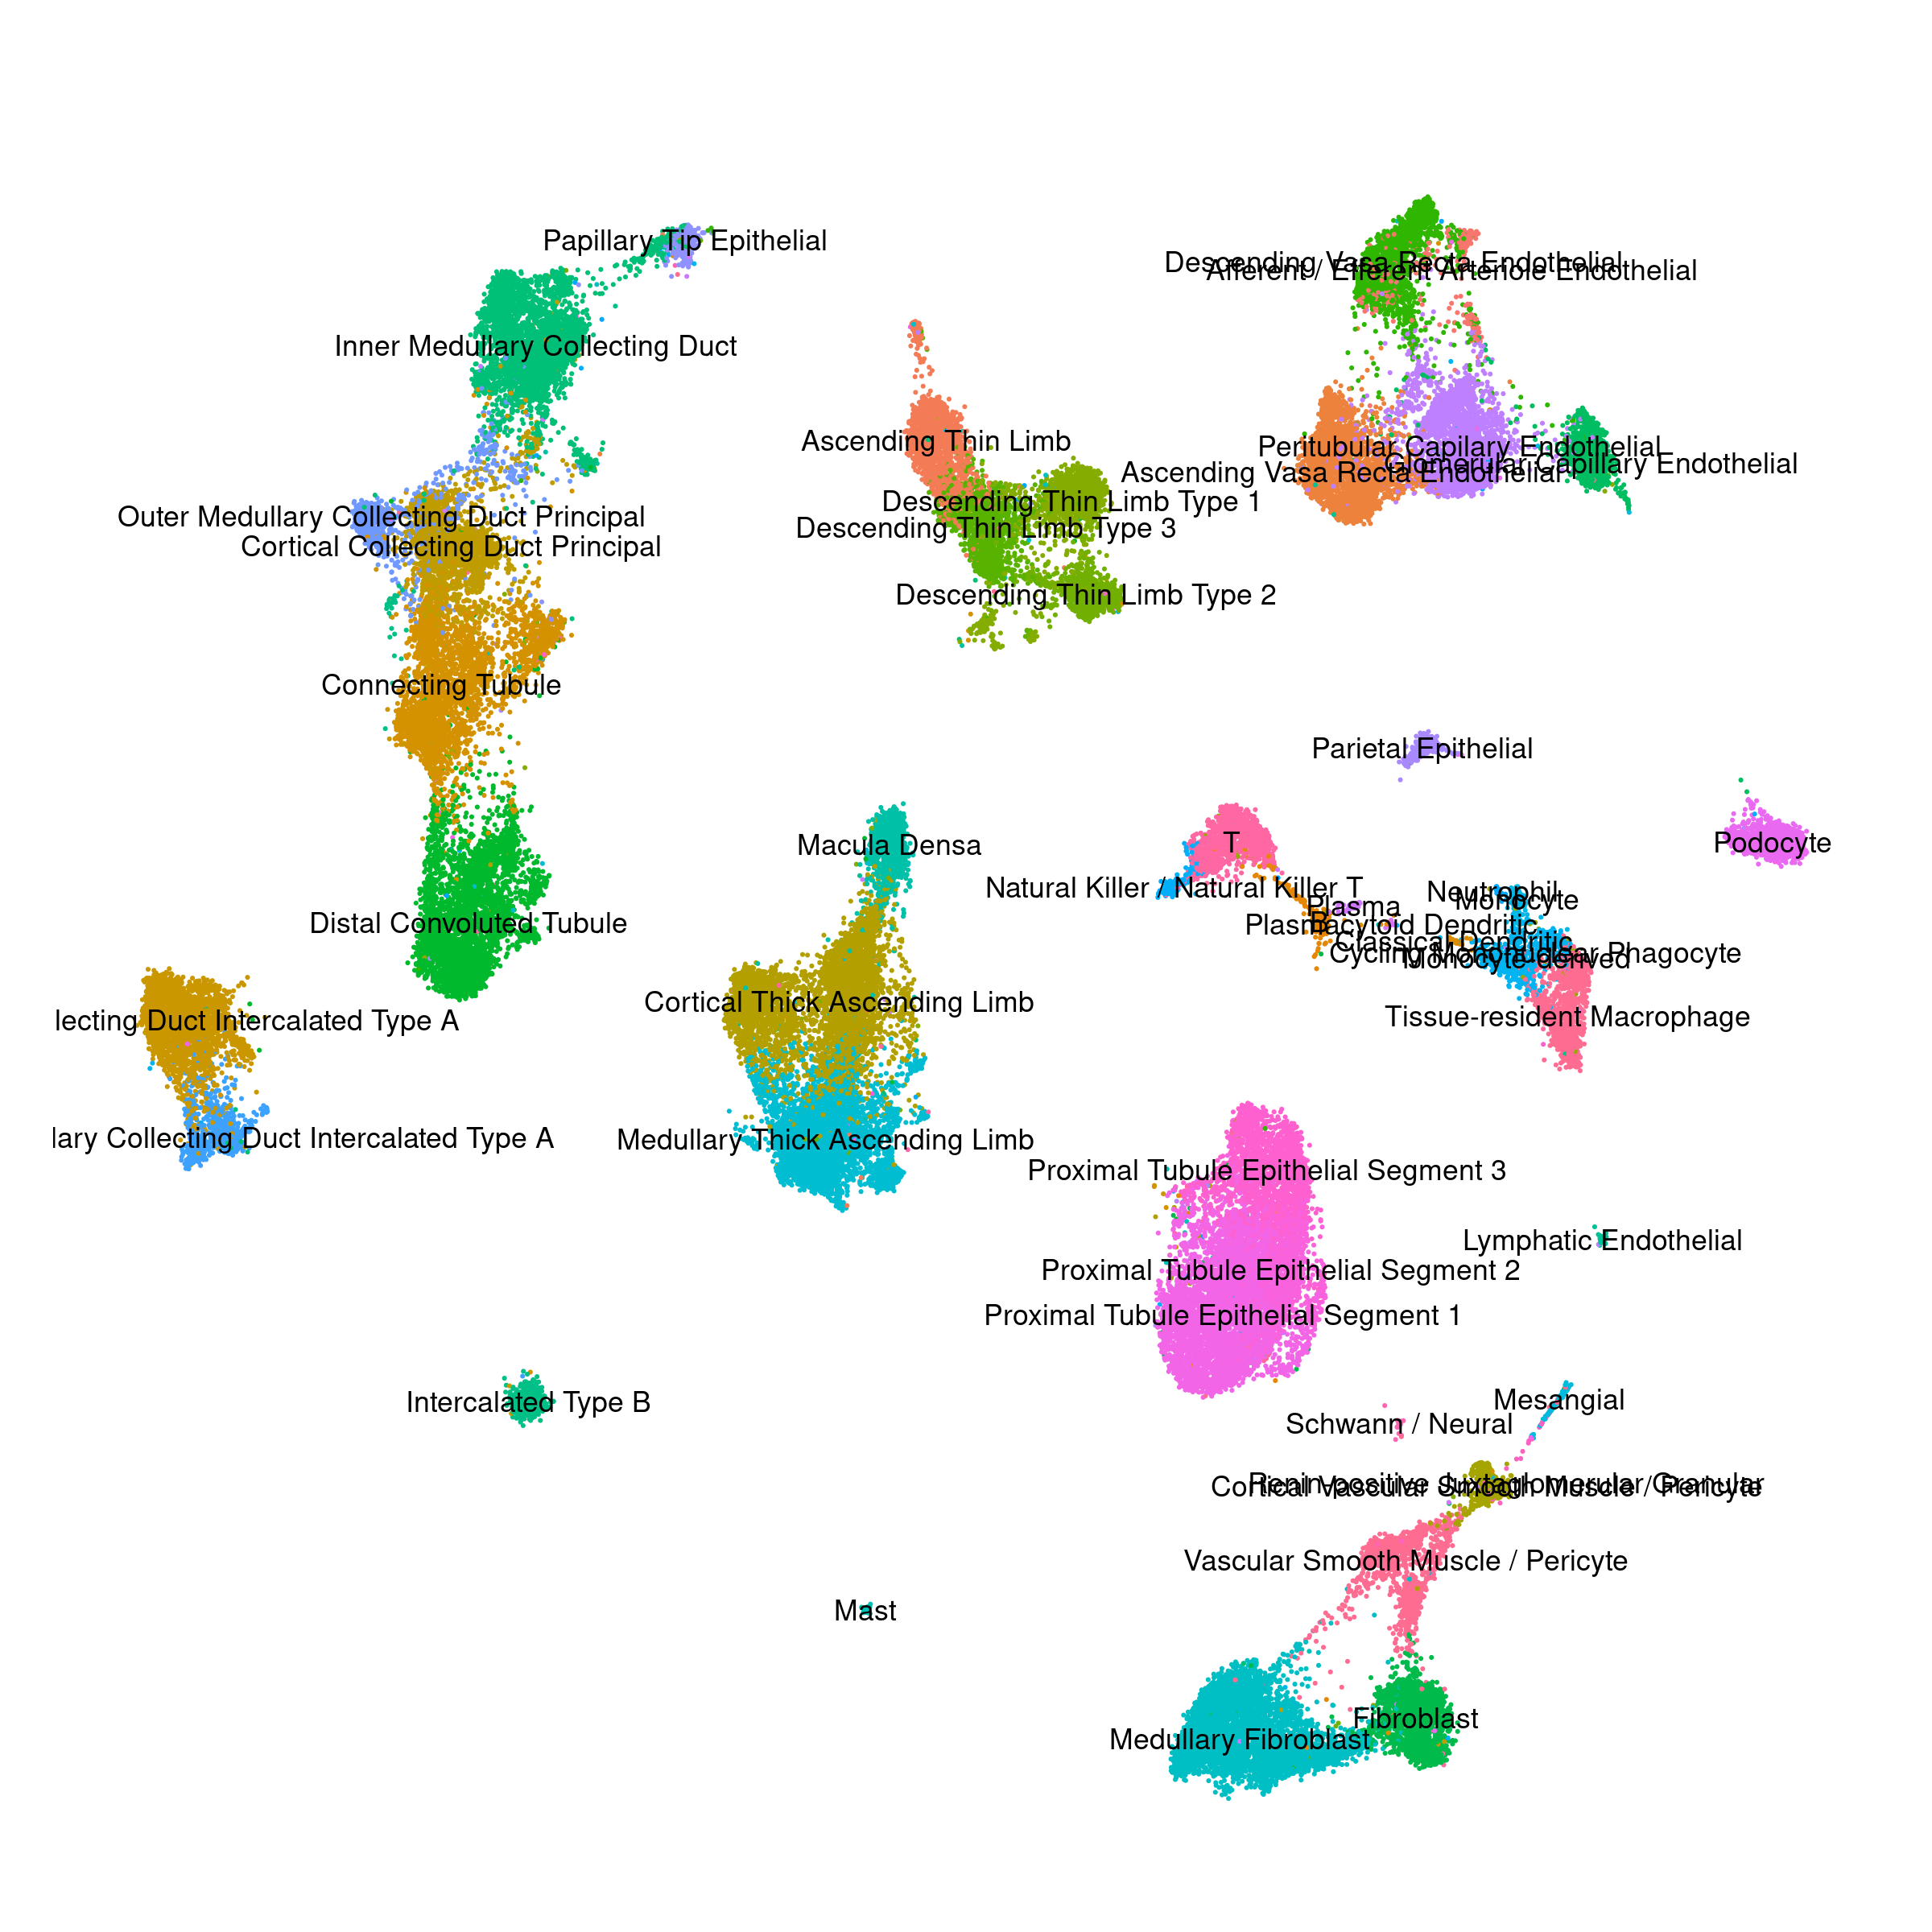
Human - Kidney
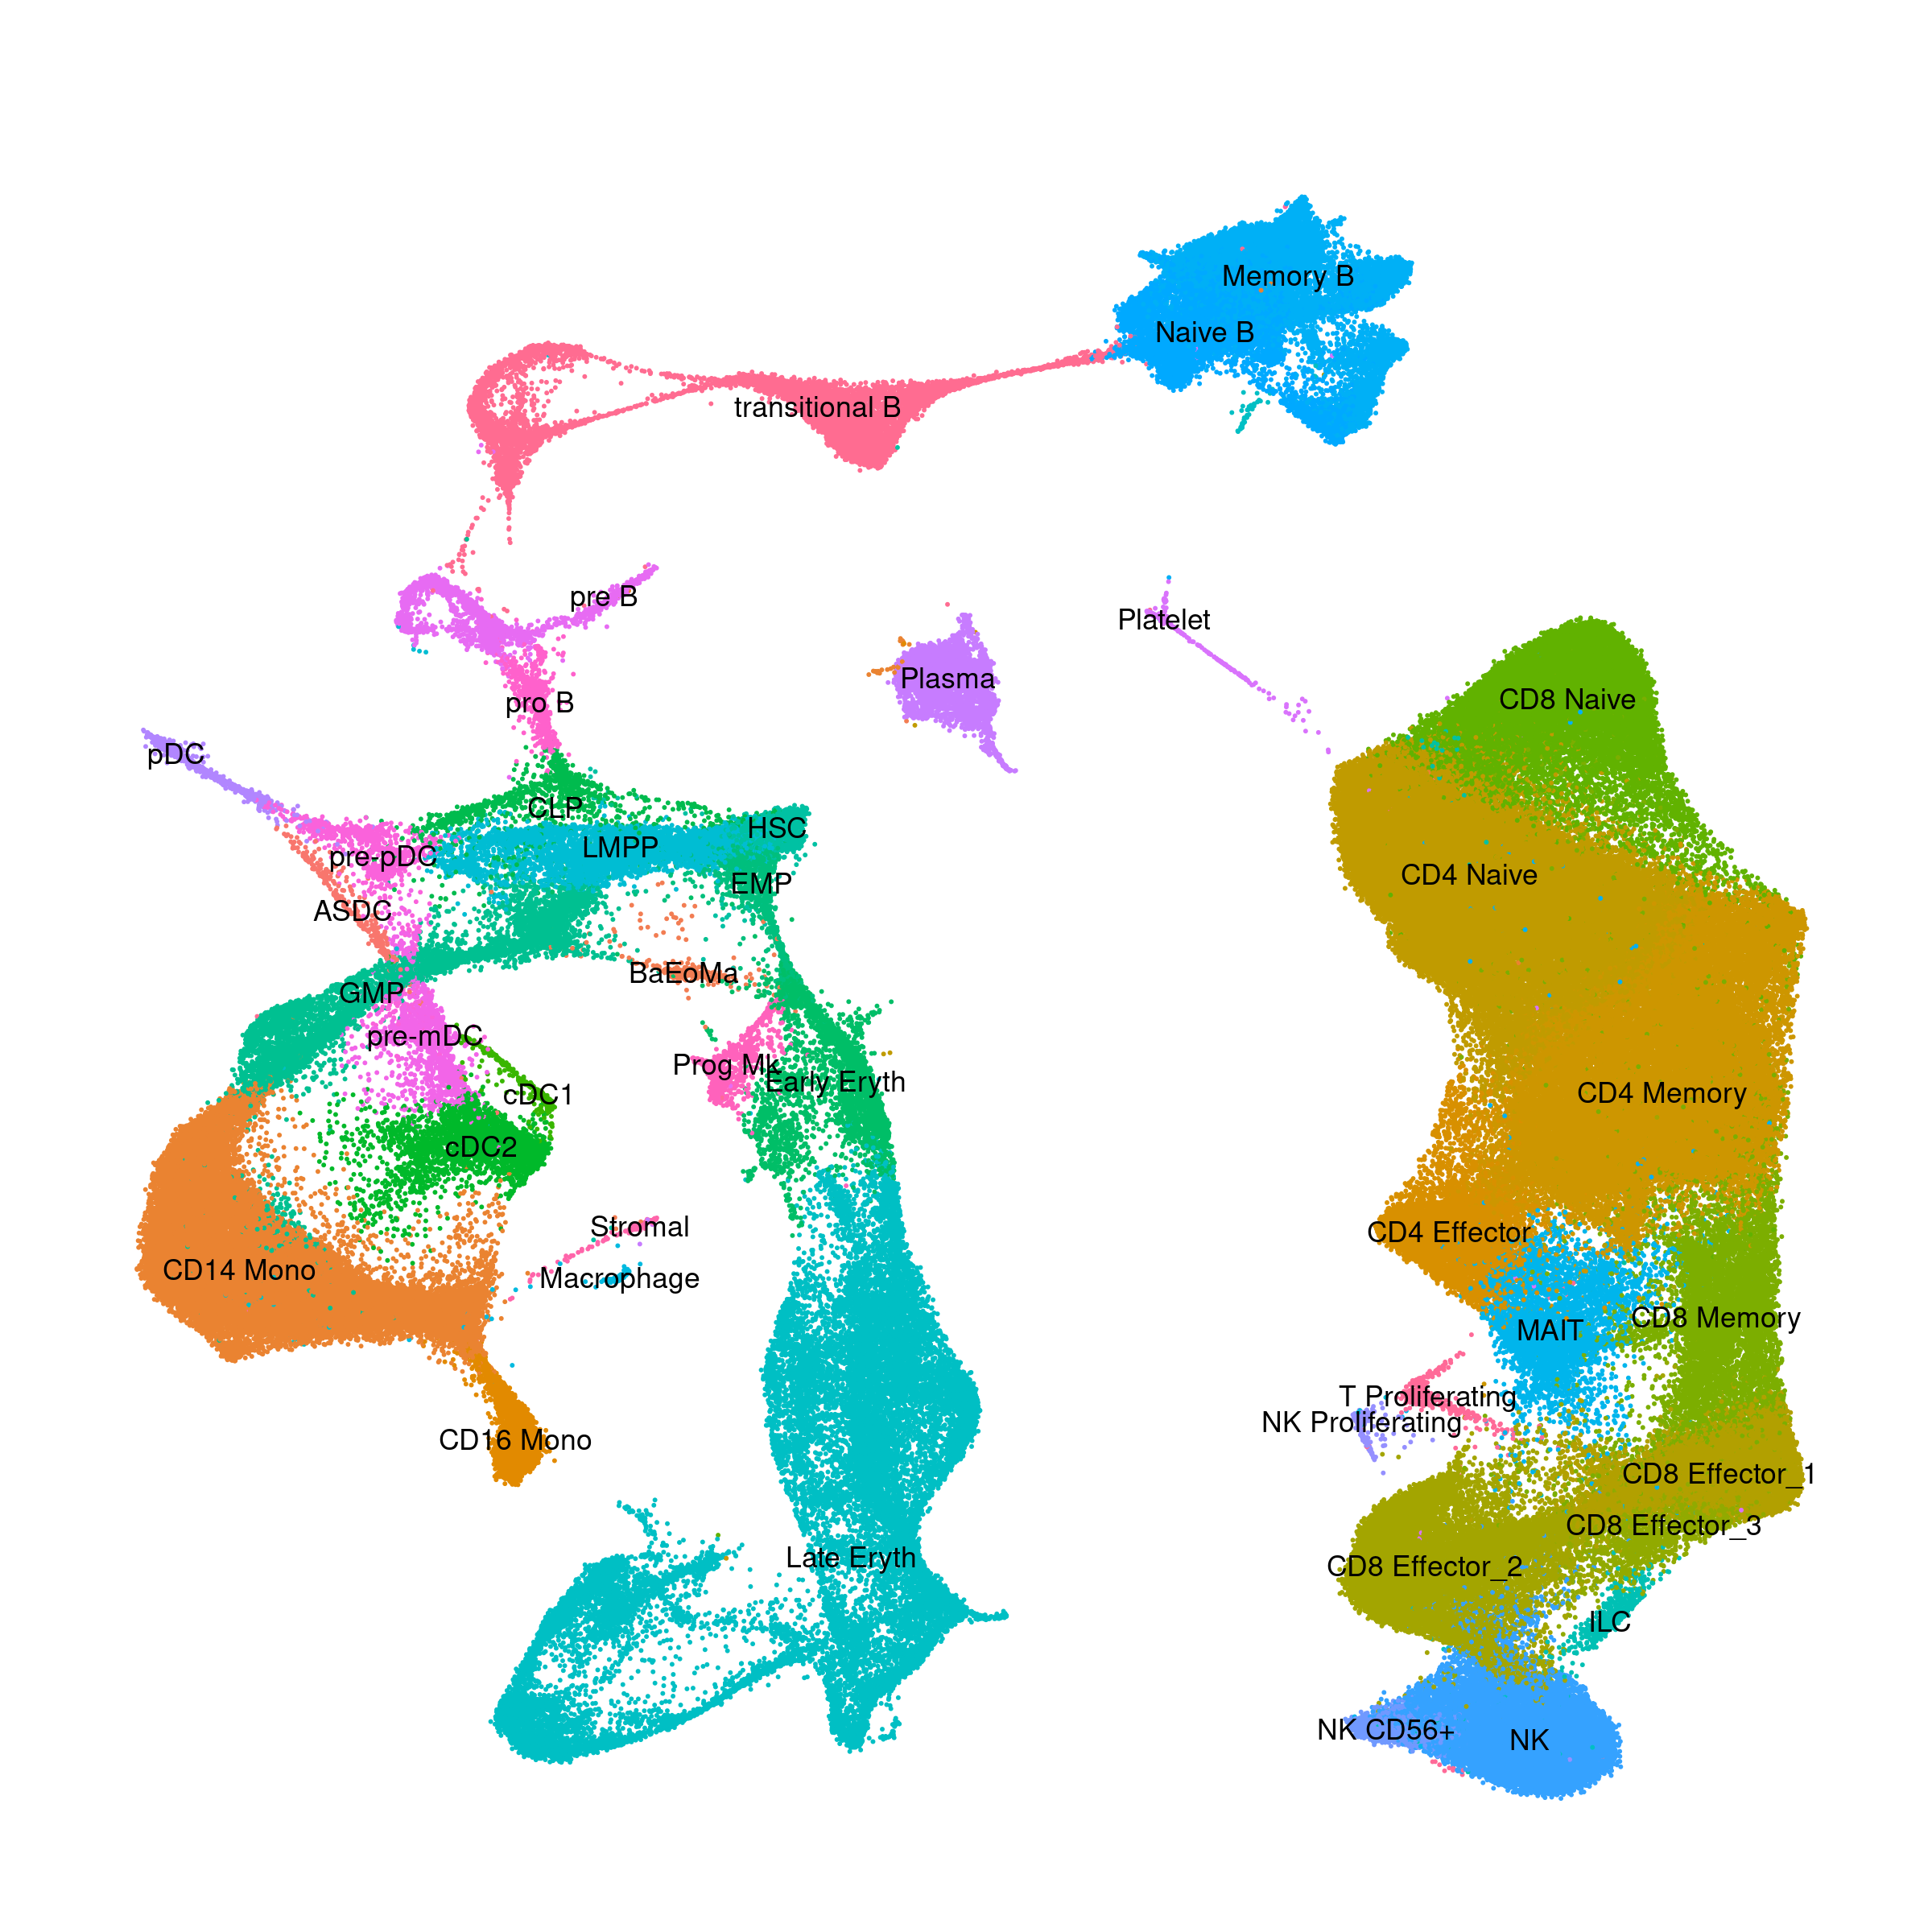
Human - Bone Marrow
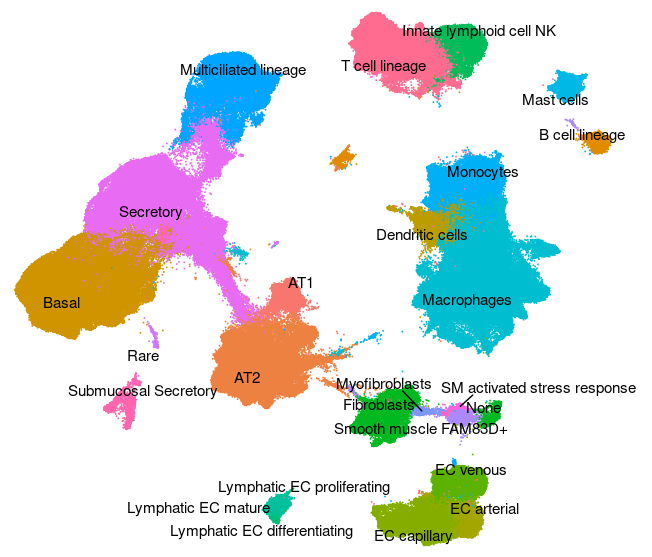
Human - Lung v2 (HLCA)
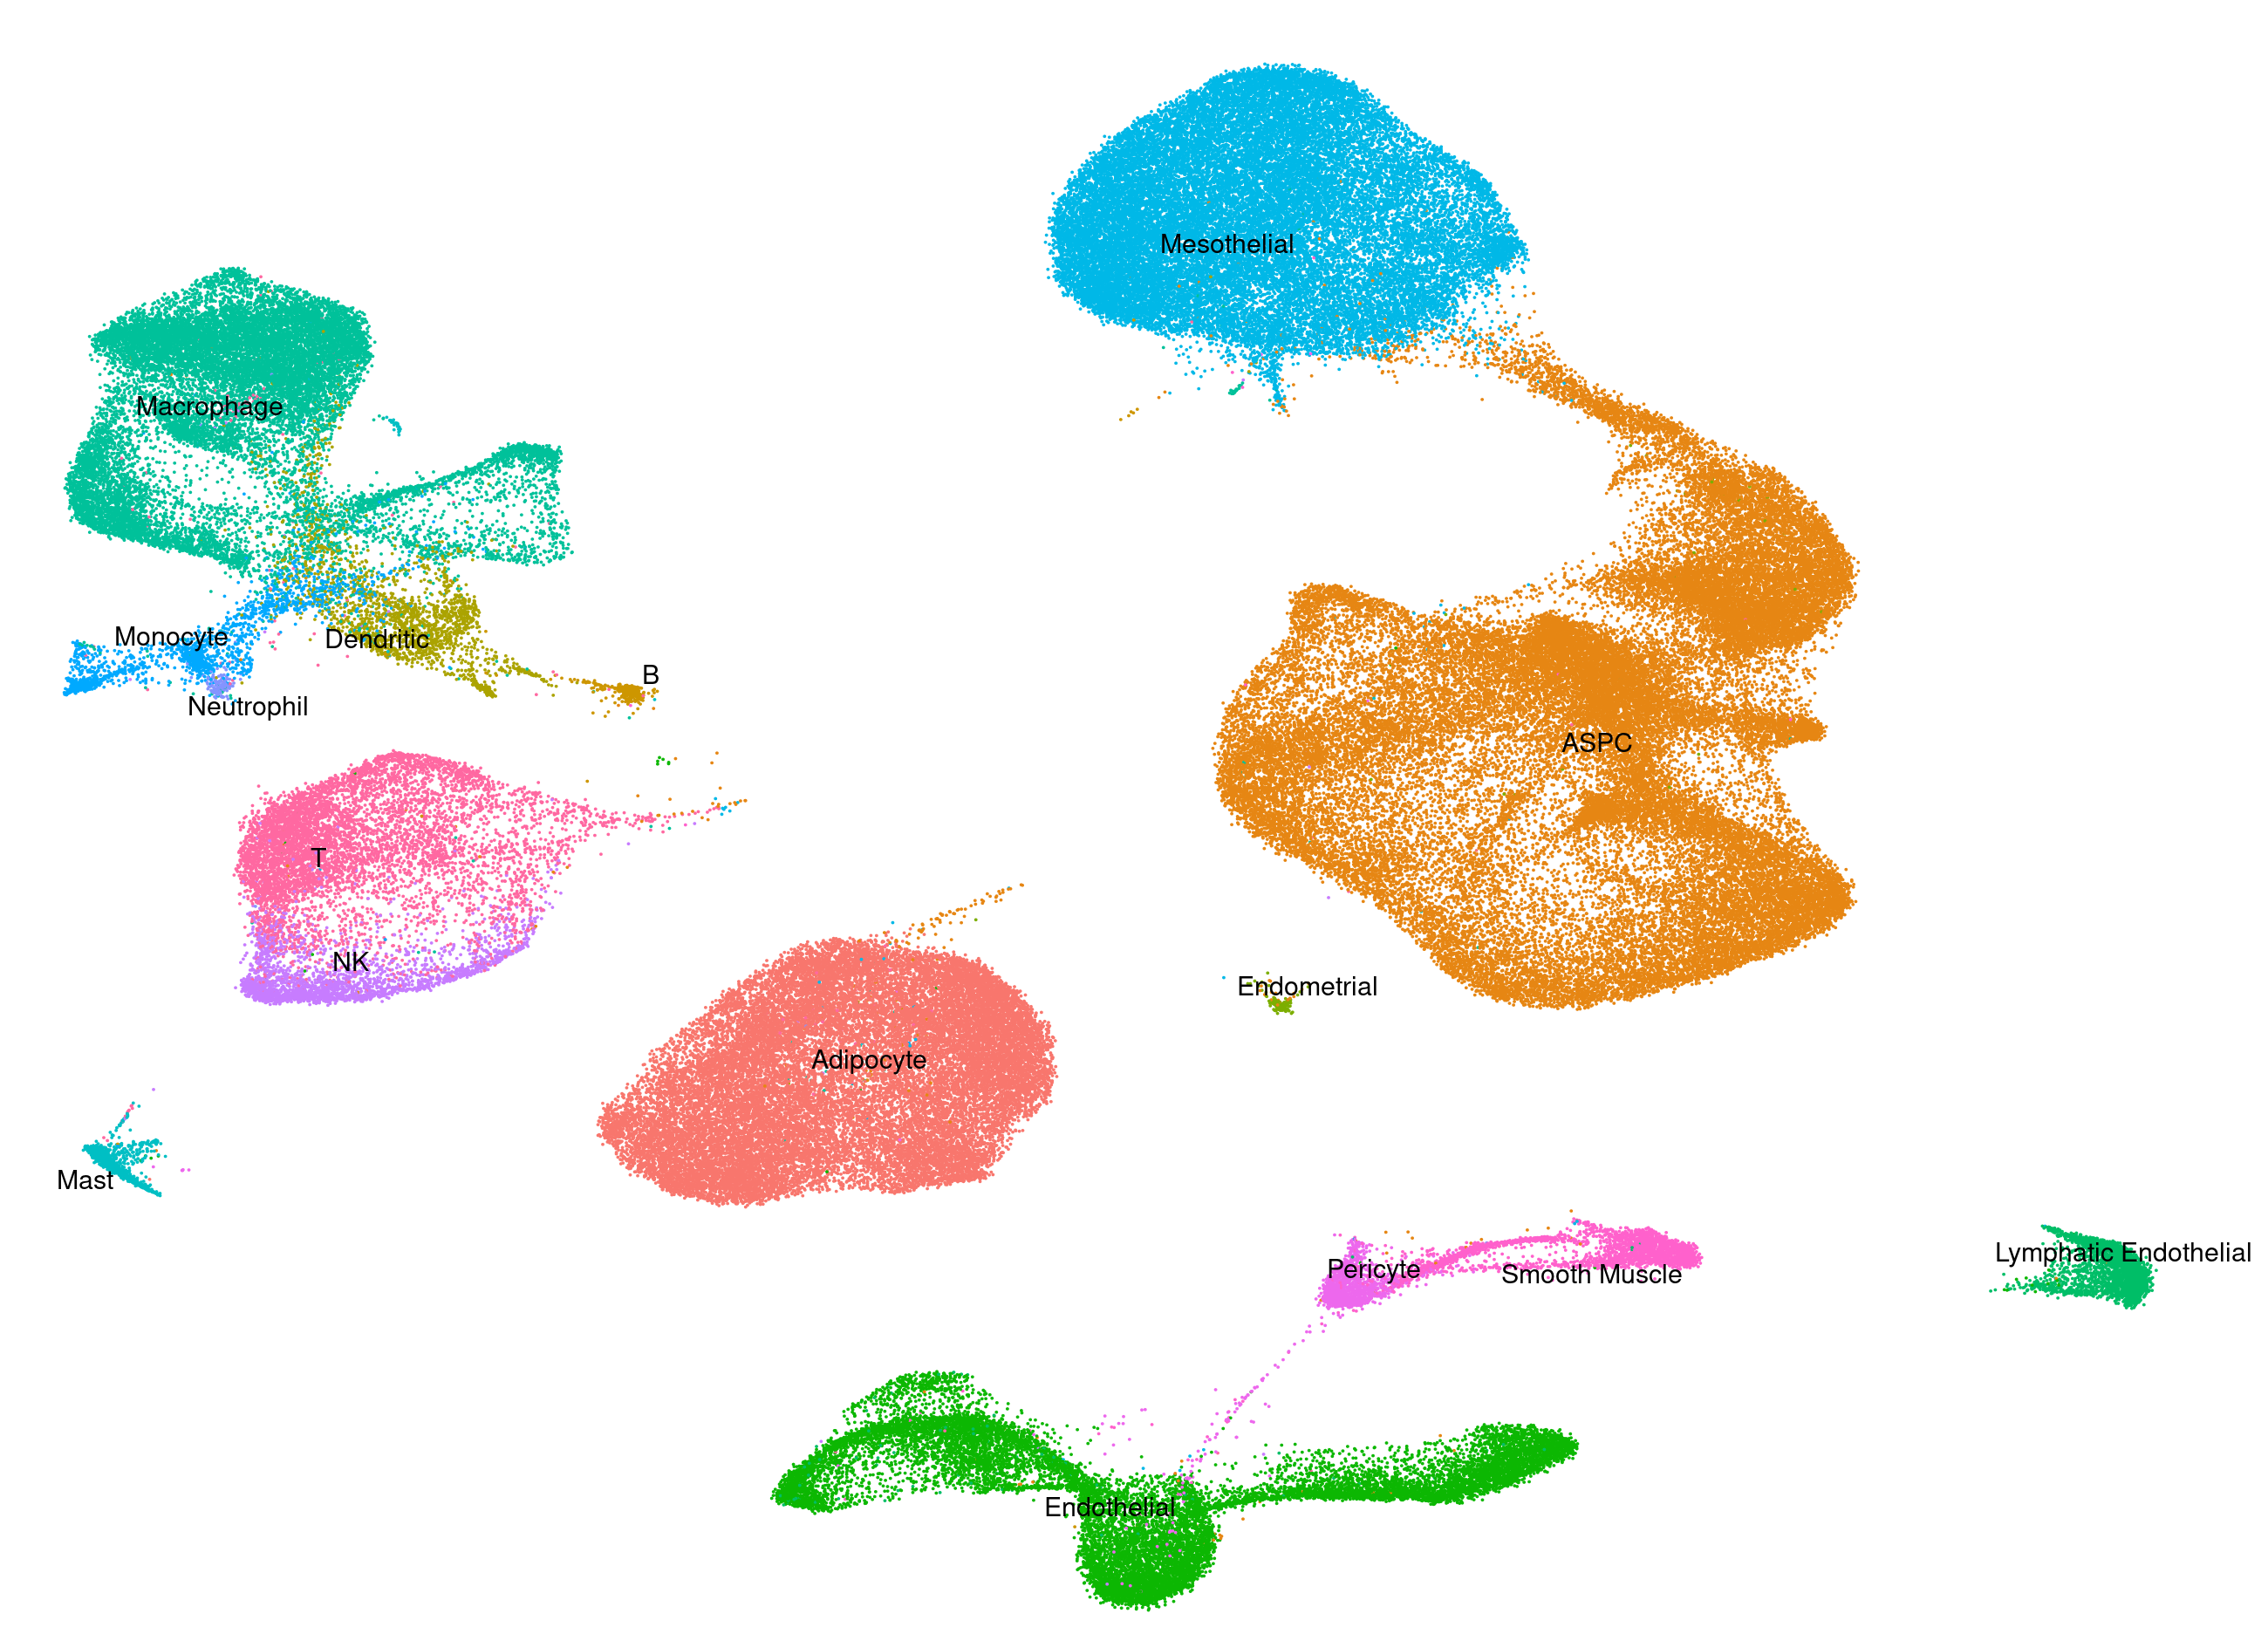
Human - Adipose
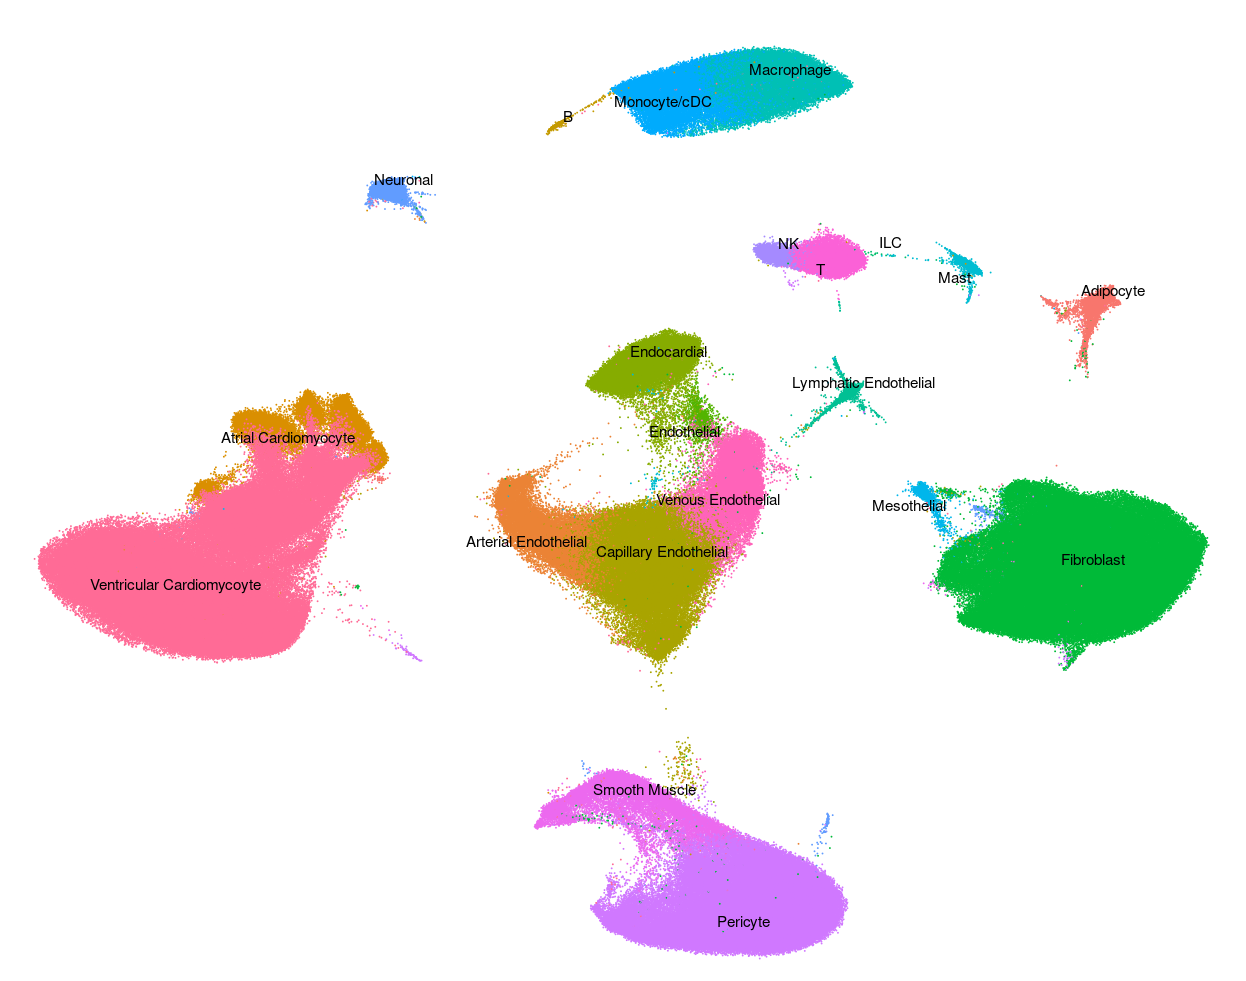
Human - Heart
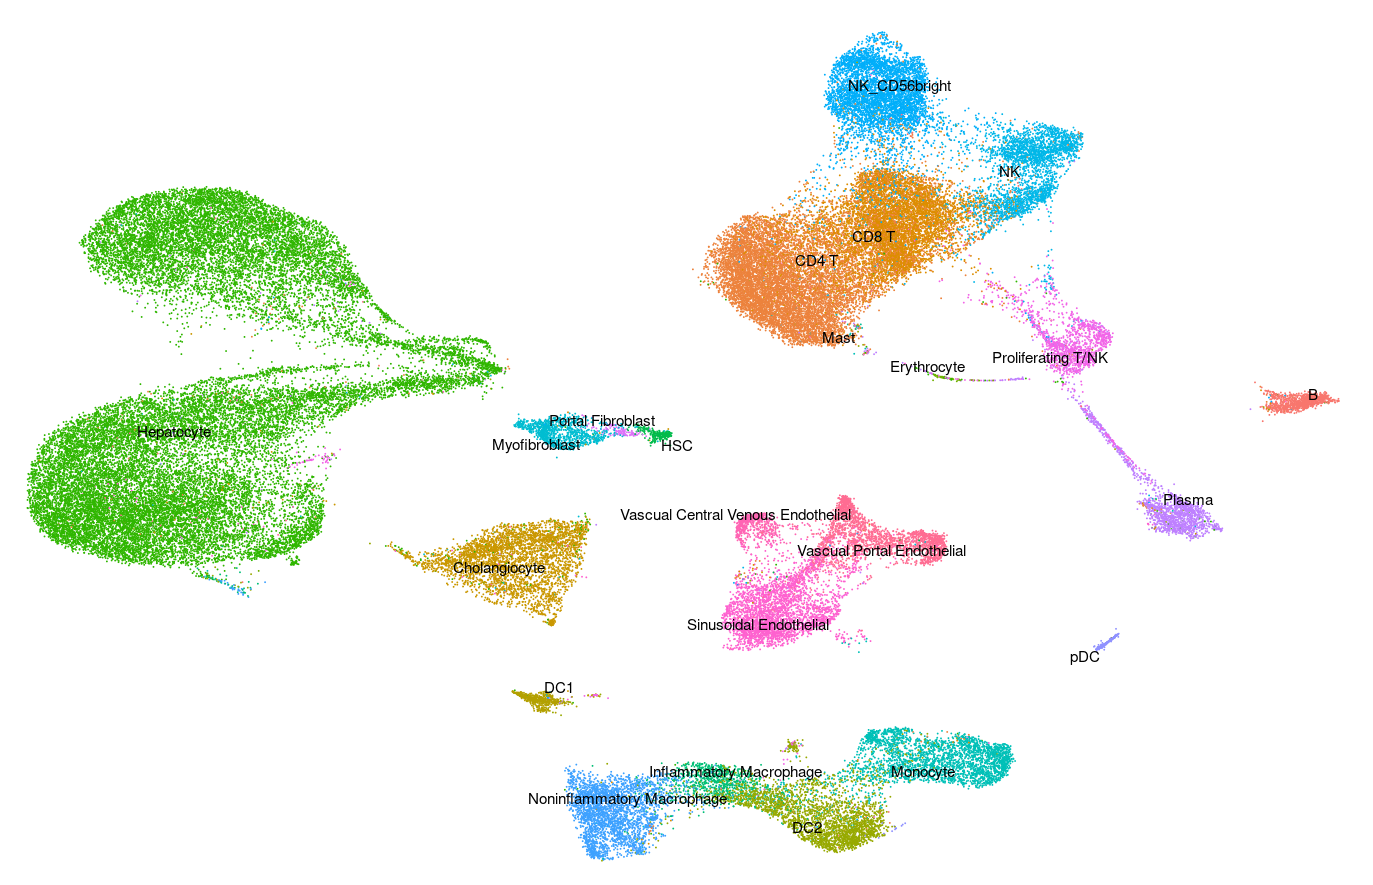
Human - Liver
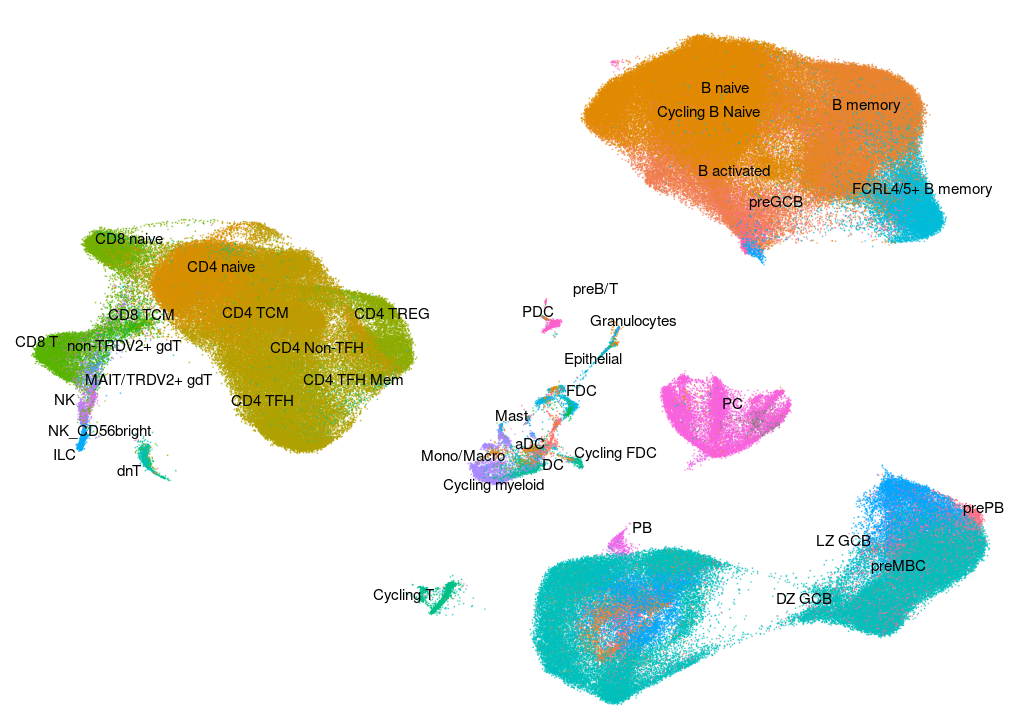
Human - Tonsil v2
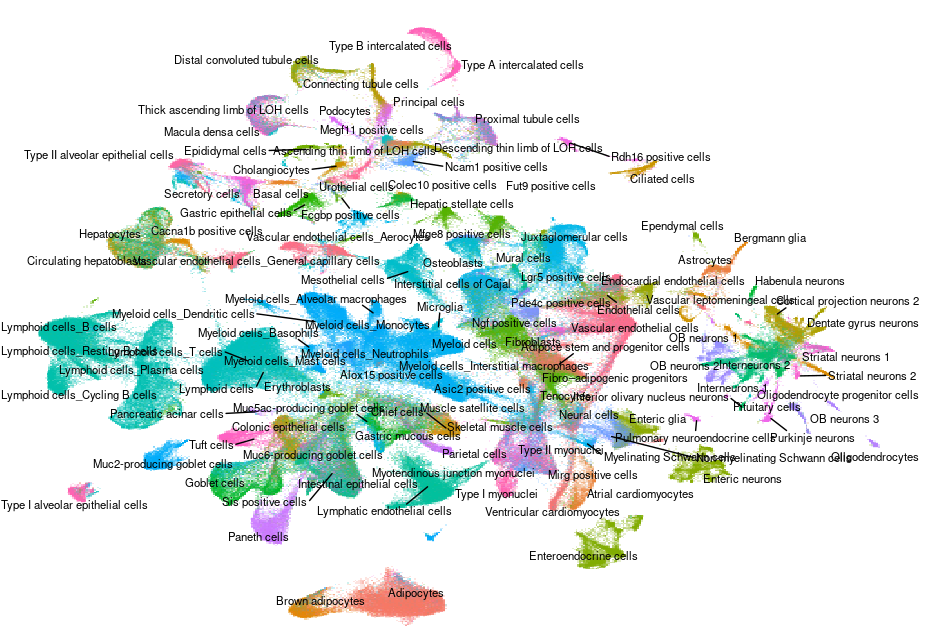
Mouse - Pansci
References for scATAC-seq Queries
Human - PBMC

Human - Bone Marrow

Previous Versions
General Workflow
- Upload a single-cell gene expression matrix, or click the
Load demo datasetbutton. - If desired, filter cells based on common QC metrics in the Preprocessing tab.
- Click the
Map cells to referencebutton to launch analysis. A query dataset of 10,000 cells will typically finish processing in less than 1 minute. - View results.
- “Cell Plots” tab: Visualize query cells and annotations projected onto the reference UMAP.
- “Feature Plots” tab: Explore the expression of individual features (genes) in your data, and automatically identify differentially expressed genes and biomarkers.
- If desired, download files for further analysis from the “Download Results” tab.
Run Azimuth Locally
You can also bypass the web application and run Azimuth on your local computer, directly in R. The following vignette demonstrates how to download a reference and map new data (either in Seurat, h5, or h5ad format), in only a few commands. Check it out here.
Frequently Asked Questions
General
The app didn’t work!
To respect user privacy, we only collect basic usage statistics and do not store logs from user sessions of the app. We aim to clearly document the requirements for user-uploaded data, provide a detailed FAQ here, and display descriptive error messages in the app whenever possible.
If the app returns an error message, you can also perform the same identical analysis using Seurat v4 following mapping vignette and find support for any problems that arise during your use of the Seurat package here.
If you are receiving an error message or are unable generate output with the app, please read the FAQ below to ensure that your dataset meets our requirements. If this doesn’t resolve your issue, and you’d like to help us improve the app, please file a Github issue describing the issue here.
Can I run the app myself?
The source code is available here. However, for users interested in performing these analyses outside the context of the Azimuth app, we suggest using Seurat v4 and using our vignette on Mapping and annotating query datasets as an example. You can also download a Seurat v4 R script from the app once your analysis is complete to reproduce the results locally.
The app won’t load!
If you see a blank screen, try clearing your cache or browser history. A previous session of yours may be interfering with the current one.
Can I open multiple apps simultaneously?
Opening multiple instances of the same app may result in unpredictable behaviors. If you would like to run multiple apps, please open them in Incognito windows or in separate browsers.
What is HuBMAP and how can I learn more?
HuBMAP is a consortium of diverse research teams funded by the Common Fund at the National Institutes of Health that is working to create a framework for mapping the body at single cell resolution to better understand how the relationships among our cells affects out health. To learn more, visit the corsortium home page here.
How do I cite Azimuth if I use it in my own work?
If you use Azimuth, please consider citing Hao et al, Cell 2021. We also encourage you to cite the original source of the reference dataset, as indicated here. For example, if you map to the Human Motor Cortex reference, please consider citing Bakken et al, bioRxiv 2020.
How can I explore gene expression patterns in the reference?
You can visualize gene expression in each reference using the explore button. This loads a page with a vitessce view of the reference data. Here you can toggle between cell annotations and also view gene expression measurements displayed on the same UMAP plot. For gene expression measurements, the color scale is the plasma option for viridis; a continuous scale between dark purple (low expression) and yellow (high expression).
Uploading Data
What file types can I upload?
We accept the following file types as input:
- Seurat objects as RDS
- 10x Genomics H5
- H5AD
- H5Seurat
- Matrix/matrix/data.frame as RDS
If uploading a Seurat object, it must contain an assay named ‘RNA’ with raw data in the ‘counts’ slot. Note that Azimuth uses only the (unnormalized) counts matrix.
Can you provide me with a sample input?
All reference apps come with a ‘demo’ dataset which can be loaded with a button on the home sidebar. These represent datasets of the same tissue as the reference but were not included in the reference itself. These can be mapped to explore the app and mapping process without requiring the user to upload any data themselves.
How big can my uploaded dataset be?
Uploads must be smaller than 1GB and contain less than 100,000 cells. If your dataset is larger than 100,000 cells, you can divide it into smaller chunks for mapping, or you can map your dataset locally using Seurat v4.
If you would like to upload an existing Seurat object, you can use DietSeurat to pare down the Seurat object before uploading it. This will preserve the RNA counts data and cell metadata, but discard everything else.
DefaultAssay(object) <- “RNA”
object <- DietSeurat(object = object, assays = “RNA”)
What datasets can I map?
To use your data in the app, we require that it has between 100 and 100,000 cells and has at least 250 genes in common with the reference. You should run the mapping algorithm locally in Seurat v4 or consider alternatives to reference mapping if your dataset does not meet these criteria.
Should I filter the genes in my dataset before uploading?
We do not recommend pre-filtering genes in the data you upload. Users should upload an unprocessed counts matrix, for example, the output of the 10x Genomics CellRanger pipeline.
Should I map my batches separately or combined?
We have observed that the results (both for visualization and annotation) are very similar when mapping individual batches separately, or combined together. This is because Azimuth can successfully remove batch effects between query and reference cells, even when there are multiple query batches. However, as discussed further below, the results of QC metrics may change. For example, cells from certain batches sometimes receive high mapping scores when the batches are mapped separately but receive low mapping scores when batches are mapped together, as the batch effect represents a source of heterogeneity in the query that is removed by Azimuth.
What optimizations are in the app that are not default in Seurat?
To optimize the web app time and resource consumption, we made several changes to the base Seurat mapping workflow.
- SCTransform
- When fitting generalized linear models, we use a representative set of 2000 genes and 2000 cells
- To further speed up GLM model fitting, we use the recently developed glmGamPoi package from Constantin Ahlmann-Eltze and Wolfgang Huber.
- Mapping
- For many references, we leverage a downsampled reference. Downsampling is done to ensure good representation of all datasets and celltypes present in the full reference.
- We leverage a previously computed and cached neighbor index and neighbor list for the reference. This speeds up the neighbor-finding steps in the mapping algorithm.
- For the approximate nearest neighbor finding steps in the algorithm, we use
n.trees = 20, which provides speedup compared to defaultn.trees = 50with minimal impact on the quality of downstream results.
- Analysis
- We leverage the presto package from Ilya Korsunsky and Soumya Rayachauduri, for differential expression
Preprocessing
Can I preprocess my data myself?
You can filter cells based on your own criteria prior to uploading data to the app. However, the query data must be normalized uniformly with the reference by the app, so you must include the unnnormalized data in the ‘RNA’ assay ‘counts’ slot.
I can’t map cells after filtering in the “Preprocessing” tab
There must be at least 100 cells remaining after filtering to proceed.
Mapping
Can I map at different levels of resolution?
Azimuth supports the ability to annotate cells at multiple levels of resolution, by selecting multiple options from the
Reference metadata to transfer box of the Preprocessing tab. For example, with the human PBMC reference, you can annotate cells based on broad celltype definition (celltype.l1), but also at two additional levels of granularity (celltype.l2 and celltype.l3)How long will mapping take?
Datasets of <10,000 cells will often finish processing in less than 1 minute. A 50,000 cell dataset may take around 3-4 minutes to preprocess, perform mapping, and prepare the visualizations; 100,000 cells may take around 8-9 minutes. Please be patient if we’re experiencing high load. It’s still running if you see the progress bar in the bottom right corner.
Can I run the mapping algorithm myself?
Yes! Reference mapping is available in Seurat v4. See our vignette on Mapping and annotating query datasets as an example. You can also download a customized Seurat v4 R script template after mapping on the “Download Results” tab to reproduce the analysis performed in the app.
Can I map to a different reference?
Currently, we provide apps for the references summarized here. However, you can build a reference and map query datasets to it using Seurat v4.
Results
What do the columns in the biomarkers table mean?
The top 10 biomarkers for predicted cell type clusters with at least 15 query cells are calculated using differential expression analysis, using the presto package. The columns of the table are:
- avgExpr: mean value of feature for cells in cluster
- auc: area under ROC
- padj: Benjamini-Hochberg adjusted p value
- pct_in: percent of cells in the cluster with nonzero feature value
- pct_out: percent of cells out of the cluster with nonzero feature value
What if my query dataset contains cell types that aren't present in the reference?
If your query dataset primarily comprises cell types that are not in the reference, the mapping will likely return poor ‘Dataset-level’ QC metrics (see Mapping QC section below). Alternately, your query dataset may be mostly comprised of reference cell types, but includes a subset of additional new populations. In this case, these cells will map to the closest cell type in the reference (e.g., neutrophils will map to monocytes in our PBMC reference). However, we expect these cells to receive poor ‘cell-level’ QC metrics, including low mapping scores (see Mapping QC section below).
Can I visualize my own metadata?
If the file format you upload supports metadata and your file contains cell-level metadata, after mapping you can visualize categorical metadata fields (with up to 50 categories) on the “Cell Plots” tab, and numerical metadata fields on the “Feature Plots” tab.
Why aren’t all the predicted cell types available in the biomarkers table?
Cell types must have at least 15 query cells of that predicted type to find biomarkers.
Where do the imputed protein values come from?
If you are using a reference with ADT data (e.g. PBMC), expression values for the proteins are imputed for all query cells based on expression values measured using antibody-derived tags (ADTs) for reference cells using CITE-seq. Imputed expression values are computed based on the measured expression values in reference cells near to a mapped query cell. They are available to download as an Assay and to visualize in the Feature Plots tab.
Can I save my results?
We do not support saving app sessions, so make sure to download the files you need before navigating away from the webpage in your browser. You can download the UMAP (Seurat Reduction RDS), cell type predictions and prediction scores (TSV), and imputed protein (Seurat Assay RDS) from the Downloads tab after mapping.
Mapping QC
How can I tell if my mapping results are accurate?
Azimuth computes a series of metrics that relate to QC for the mapping procedure. We’ve found that a single metric is insufficient to describe the quality of mapping, and therefore compute each of the metrics below. We emphasize that users should not limit their evaluation of mapping to these QC metrics, and can should explore their results. In particular, we encourage users to explore whether the differentially expressed genes associated with each annotated biological population are consistent with their biological expectations. We intend to support these metrics and QC analyses with additional visualizations in future versions.
Dataset-level Metrics:
- % of query cells with anchors: The Azimuth reference-mapping procedure first identifies a set of ‘anchors’, or pairwise correspondences between cells predicted to be in a similar biological state, between query and reference datasets. Here we report the percentage of query cells participating in an anchor correspondence. Typically, we observe values >15% when mapping is successful. Processing mismatched biological datasets (i.e. mapping a query dataset of human brain cells onto a reference dataset of human blood cells) will return few anchors (<5%). However, in some cases, when there is a large batch effect between query and reference datasets from the same tissue, this metric can fall below 15% even when mapping is successful.
- Cluster preservation score: For each query dataset, we downsample to at most 5,000 cells, and perform an unsupervised clustering. This score reflects the preservation of the unsupervised cluster structure, and is based on the entropy of unsupervised cluster labels in each query cell’s local neighborhood after mapping. Scores are scaled from 0 (poor) to 5 (best). This metric relies on the unsupervised clustering representing corresponding to biologically distinct cell states. If the query dataset consists of a homogeneous group of cells, or if the query dataset contains cells from multiple batches (which would be corrected by Azimuth), this metric may return a low value even in cases where mapping is successful. The score is calculated using the
ClusterPreservationScorefunction in Azimuth.
Cell-level Metrics:
- Prediction scores: Cell prediction scores range from 0 to 1 and reflect the confidence associated with each annotation. Cells with high-confidence annotations (for example, prediction scores > 0.75) reflect predictions that are supported by mulitple consistent anchors. Prediction scores can be visualized on the Feature Plots tab, or downloaded on the Download Results tab. The prediction depends on the specific annotation for each cell. Therefore, if you are mapping cells at multiple levels of resolution (for example level 1/2/3 annotations in the Human PBMC reference), each level will be associated with a different prediction score.
- Mapping scores: This value from 0 to 1 reflects confidence that this cell is well represented by the reference. The “mapping.score” column is available to plot in the Feature Plots tab, and is provided in the download TSV file. The mapping score is independent of a specific annotation, is calculated using the
MappingScorefunction in Seurat, and reflects how well the unique structure of a cell’s local neighborhood is preserved during reference mapping.
How can a cell get a low prediction score and a high mapping score?
A cell can get a low prediction score because its probability is equally split between two clusters (for example, for some cells, it may not be possible to confidently classify them between the two possibilities of CD4 Central Memory (CM), and Effector Memory (EM), which lowers the prediction score, but the mapping score will remain high.
How can a cell get a high prediction score and a low mapping score?
A high prediction score means that a high proportion of reference cells near a query cell have the same label. However, these reference cells may not represent the query cell well, resulting in a low mapping score. Cell types that are not present in the reference should have lower mapping scores. For example, we have observed that query datasets containing neutrophils (which are not present in our reference), will be confidently annotated as CD14 Monocytes, as Monocytes are the closest cell type to neutrophils, but receive a low mapping score.